
The problem with scheduling a live-event company
A production company runs dozens of shows at once, and each one is really three jobs stacked together: a load-in, the event, and a teardown — each with a date, a venue, and a crew lead. Multiply that by every festival, wedding, conference, and concert on the books, and the schedule becomes the single most important — and most fragile — document in the company.
The turn: the information existed, just nowhere anyone could trust
For years it lived where these things always live: a pile of spreadsheets, a shared calendar, and one or two people who "just know." That works until two shows want the same crew on the same night, a teardown falls off the list, or the person who knows is on vacation. The information exists — it's just not in one place anyone can trust.
What we built
One board. It started as a Google Sheets and Apps Script tool — forms in, spreadsheet out — which was the perfect way to prove the workflow. As it grew, we folded data from dozens of separate spreadsheets into a single database and gave the schedule two ways to look at itself, both behind one company sign-in.
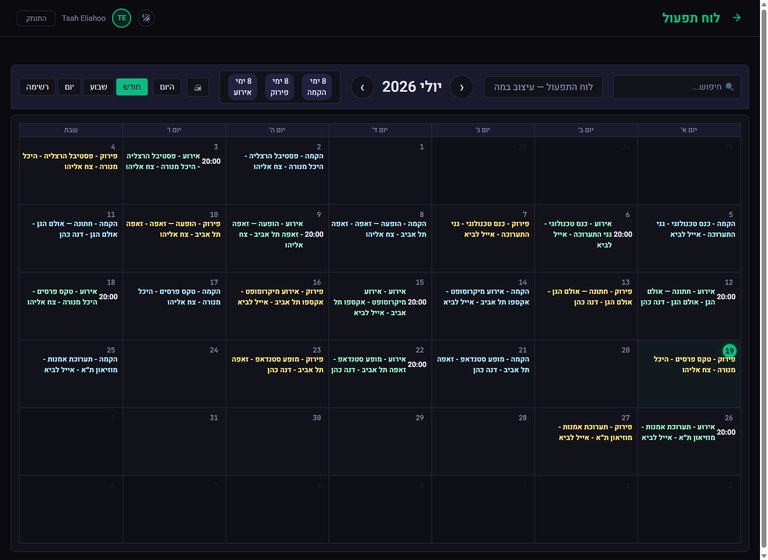
The calendar — what's happening, and when
Every task in the operation, color-coded by type — setup, event, teardown — laid out across the month. One glance answers "what are we doing this week, and who's on it."
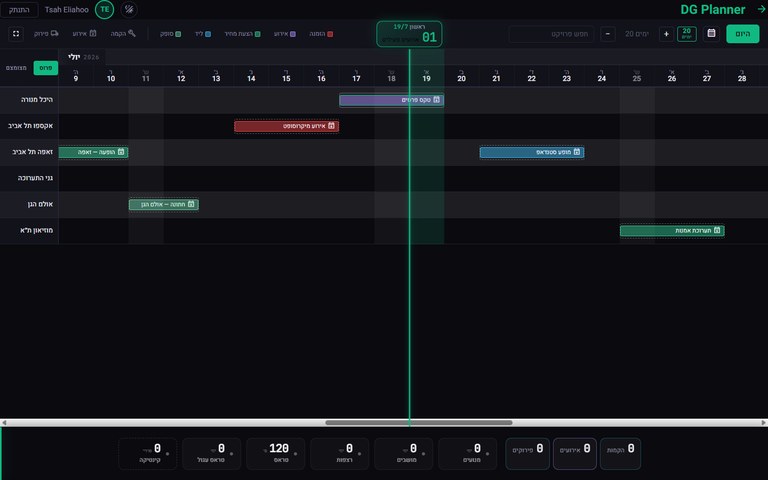
The planner — is this venue, this crew, free?
The same data, drawn as a resource timeline: one track per venue, each project a bar across the days it runs. This is the view that catches the clash before it happens — you see the overlap.
The results: how it runs on zero servers
| Item | Cost |
|---|---|
| Servers | 0 — none exist |
| Database (serverless Postgres) | free tier |
| Hosting (static app) | free tier |
There is no server to maintain. The app is a static page; the data lives in a serverless Postgres database; sign-in is the company's existing Google Workspace account, domain-restricted, so there are no new passwords. The whole system runs inside free tiers — and it sits alongside the company's other tools (logistics, media search) behind the same single login, so the office learns one door, not five.
What we learned
- No-code is the perfect prototype — and the wrong finish line. Sheets and Apps Script proved exactly what the schedule needed to do. The migration to a real database is what let it scale from a clever spreadsheet to the company's operational backbone.
- Two views beat one. A calendar answers "what's on this week." A resource timeline answers "is this venue or crew already taken." Forcing both into one layout serves neither; the same data, shown two ways, serves both.
- Color is comprehension. Setup / event / teardown as three colors turns a wall of Hebrew text into an at-a-glance read — the difference between a schedule people check and one they avoid.
- One login, one source of truth. Folding the calendar into a unified hub means there's exactly one place the schedule lives, and exactly one account to remember. Fragmentation is the enemy of trust.
Where this applies
If your operation coordinates people, places, and time across many concurrent jobs, this fits:
- Event production, staging, and AV companies
- Rental houses and venues juggling overlapping bookings
- Field-service and installation teams scheduling crews across sites
- Any operation that outgrew a shared spreadsheet but doesn't want enterprise scheduling software
Your schedule in one place, on infrastructure you own, readable at a glance — and no servers to keep alive.
Is your schedule spread across five spreadsheets?
Let's talk about putting it on one board the whole team trusts.
Talk to Us